Wind Power Forecasting
Forecasting a wind turbine's power output: a direct LSTM against a two-stage LSTM → Random Forest pipeline. The direct model halves the error.
- Type
- Smaller projects
- Date
- April 24, 2025
- Result
- Direct LSTM: RMSE 375 kW, against 720 kW for the two-stage pipeline
- Tools
- Deep LearningTime SeriesEnergy
- Links
- Source

Overview
Short-term wind power prediction for a single turbine, comparing two strategies: (1) a direct LSTM that predicts power output, and (2) an indirect LSTM → Random Forest, where the LSTM predicts the weather features and a Random Forest turns them into power. The pipeline covers preprocessing, training, evaluation and plots for both.
Motivation
Accurate wind power forecasting is critical for grid stability and energy planning. Grid operators need to know how much power turbines will produce in the next hours. This project uses public turbine data to test whether splitting the problem in two (forecast the weather, then map weather to power) beats predicting power directly.
Technical Approach
- Dataset: Hourly wind turbine data (
Active Power,Wind Speed,Wind Direction,Power Curve) - Preprocessing:
- Resampling to hourly intervals
- Handling missing values with forward/backward filling
- Scaling with
MinMaxScaler
- Two Forecasting Pipelines:
- Direct: LSTM → Power
- Indirect: LSTM → Features → Random Forest → Power
- Modeling:
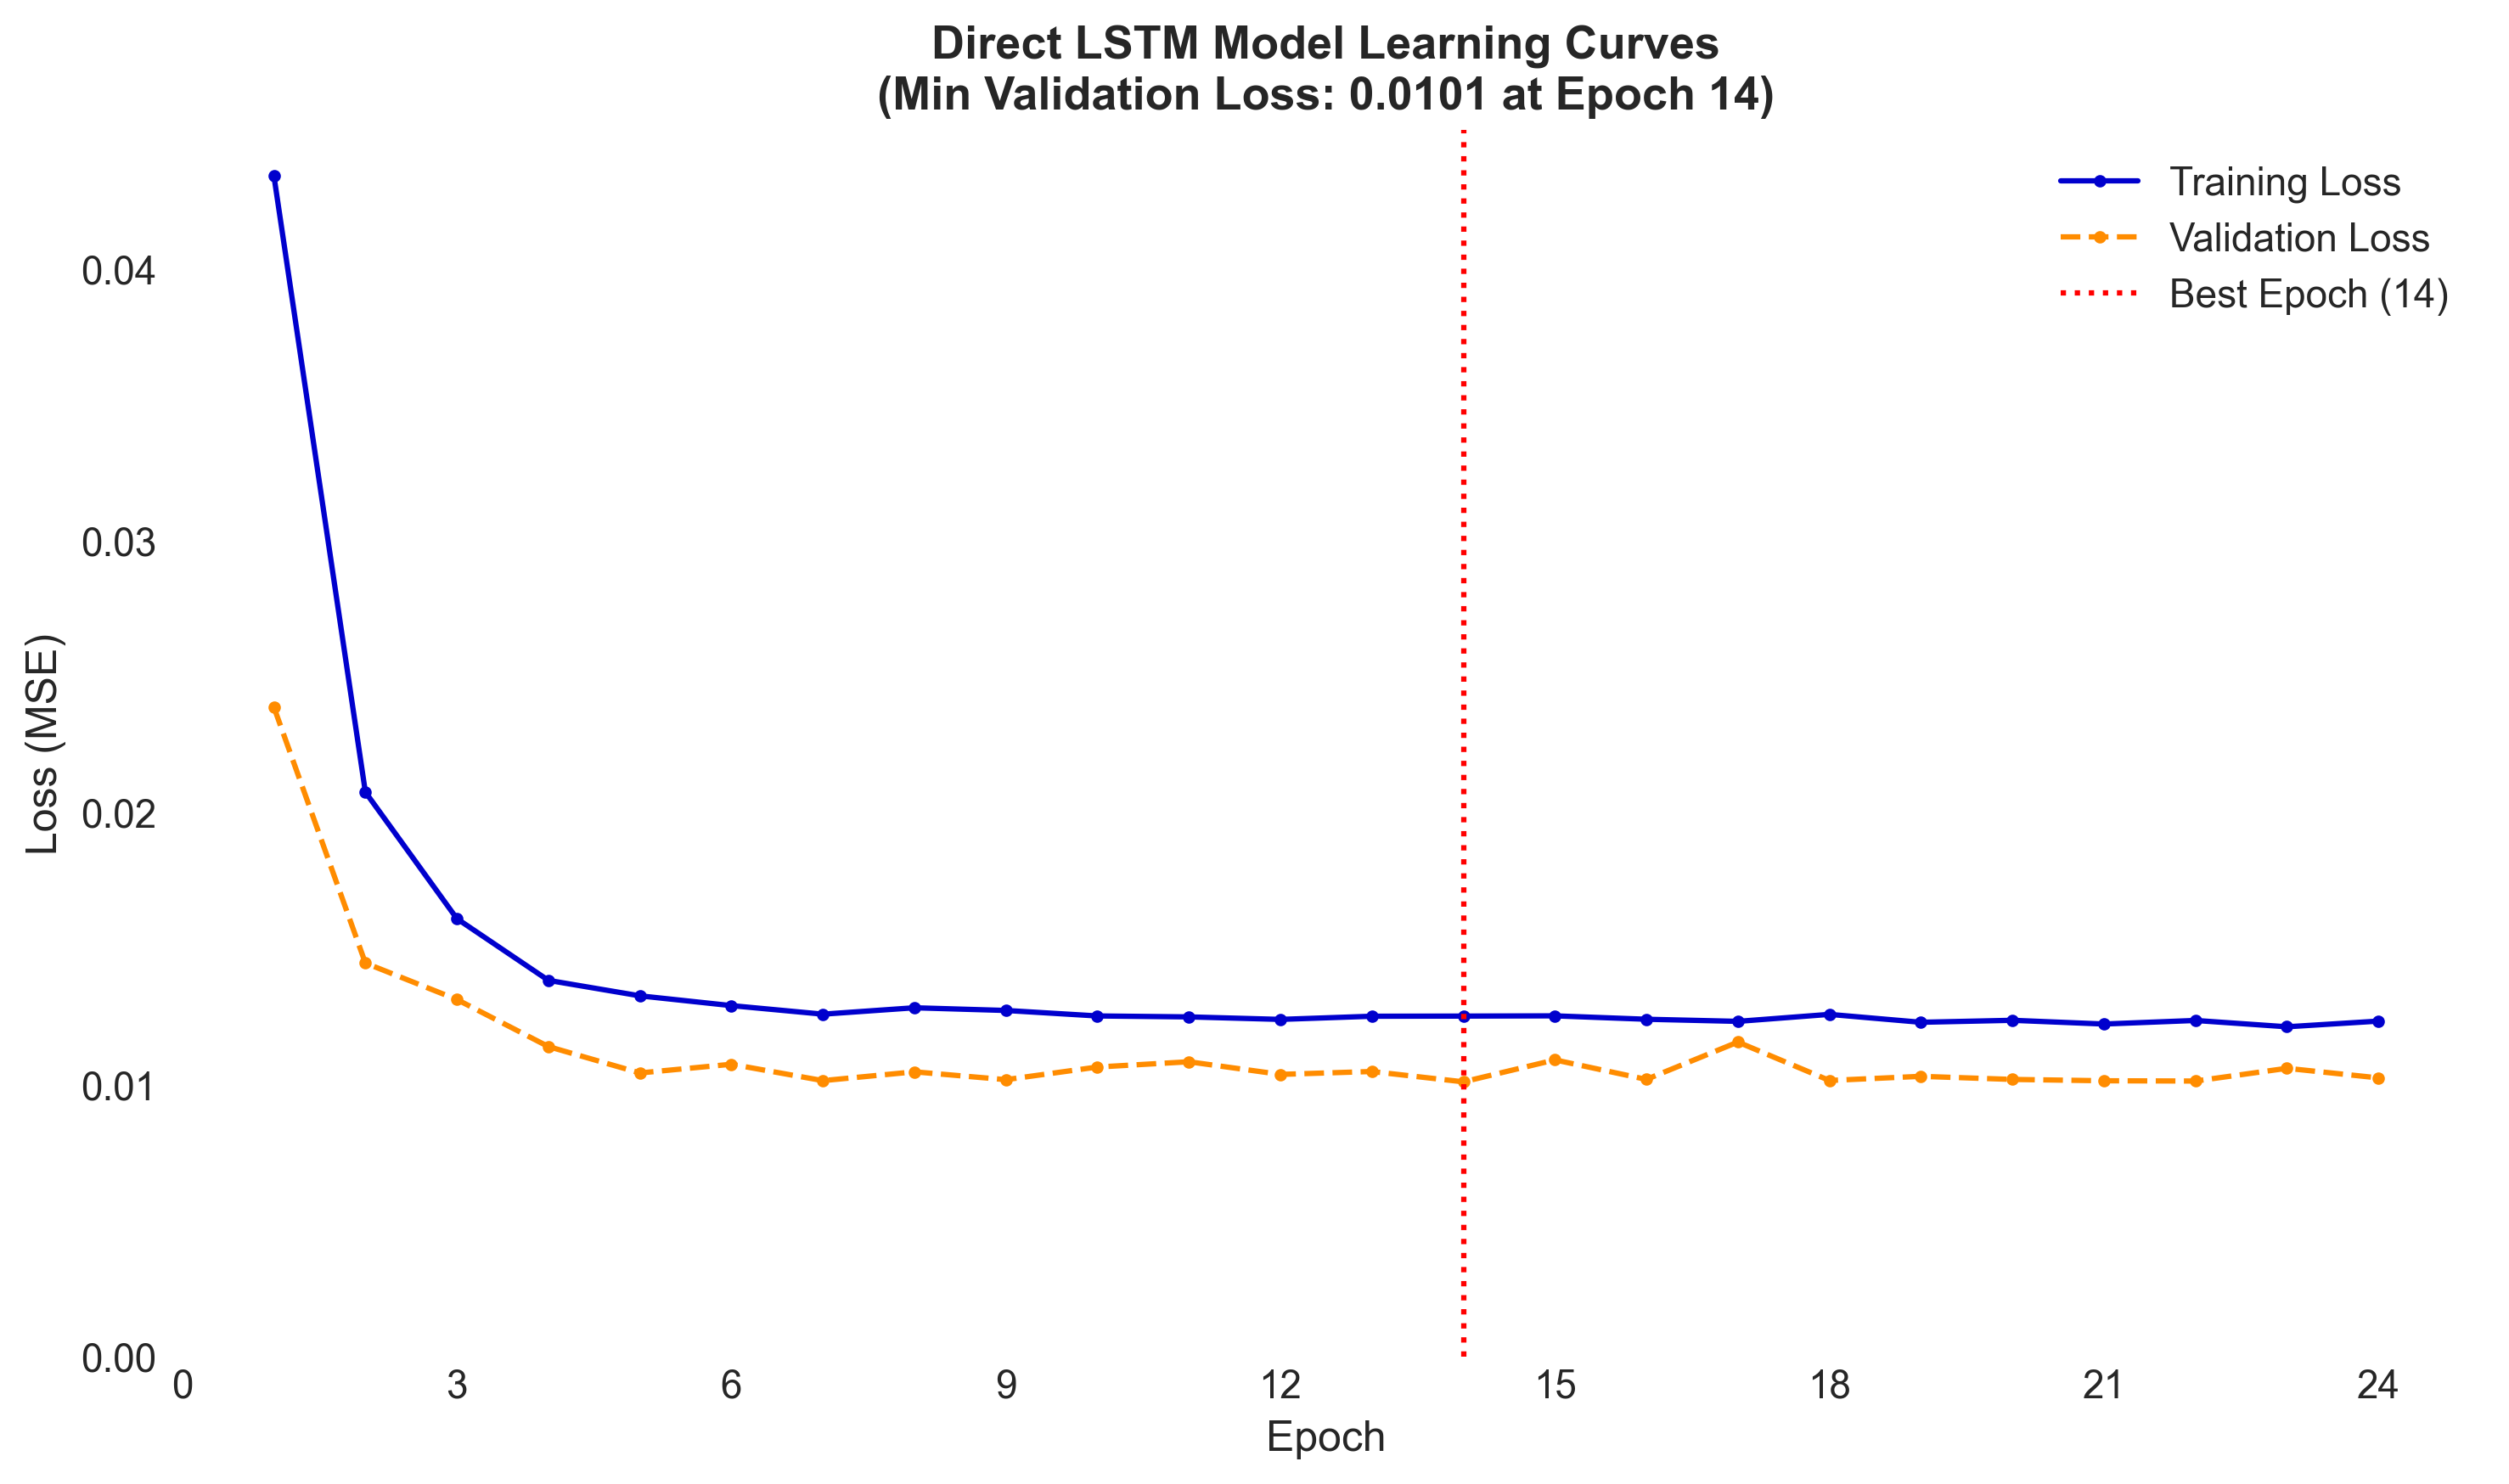
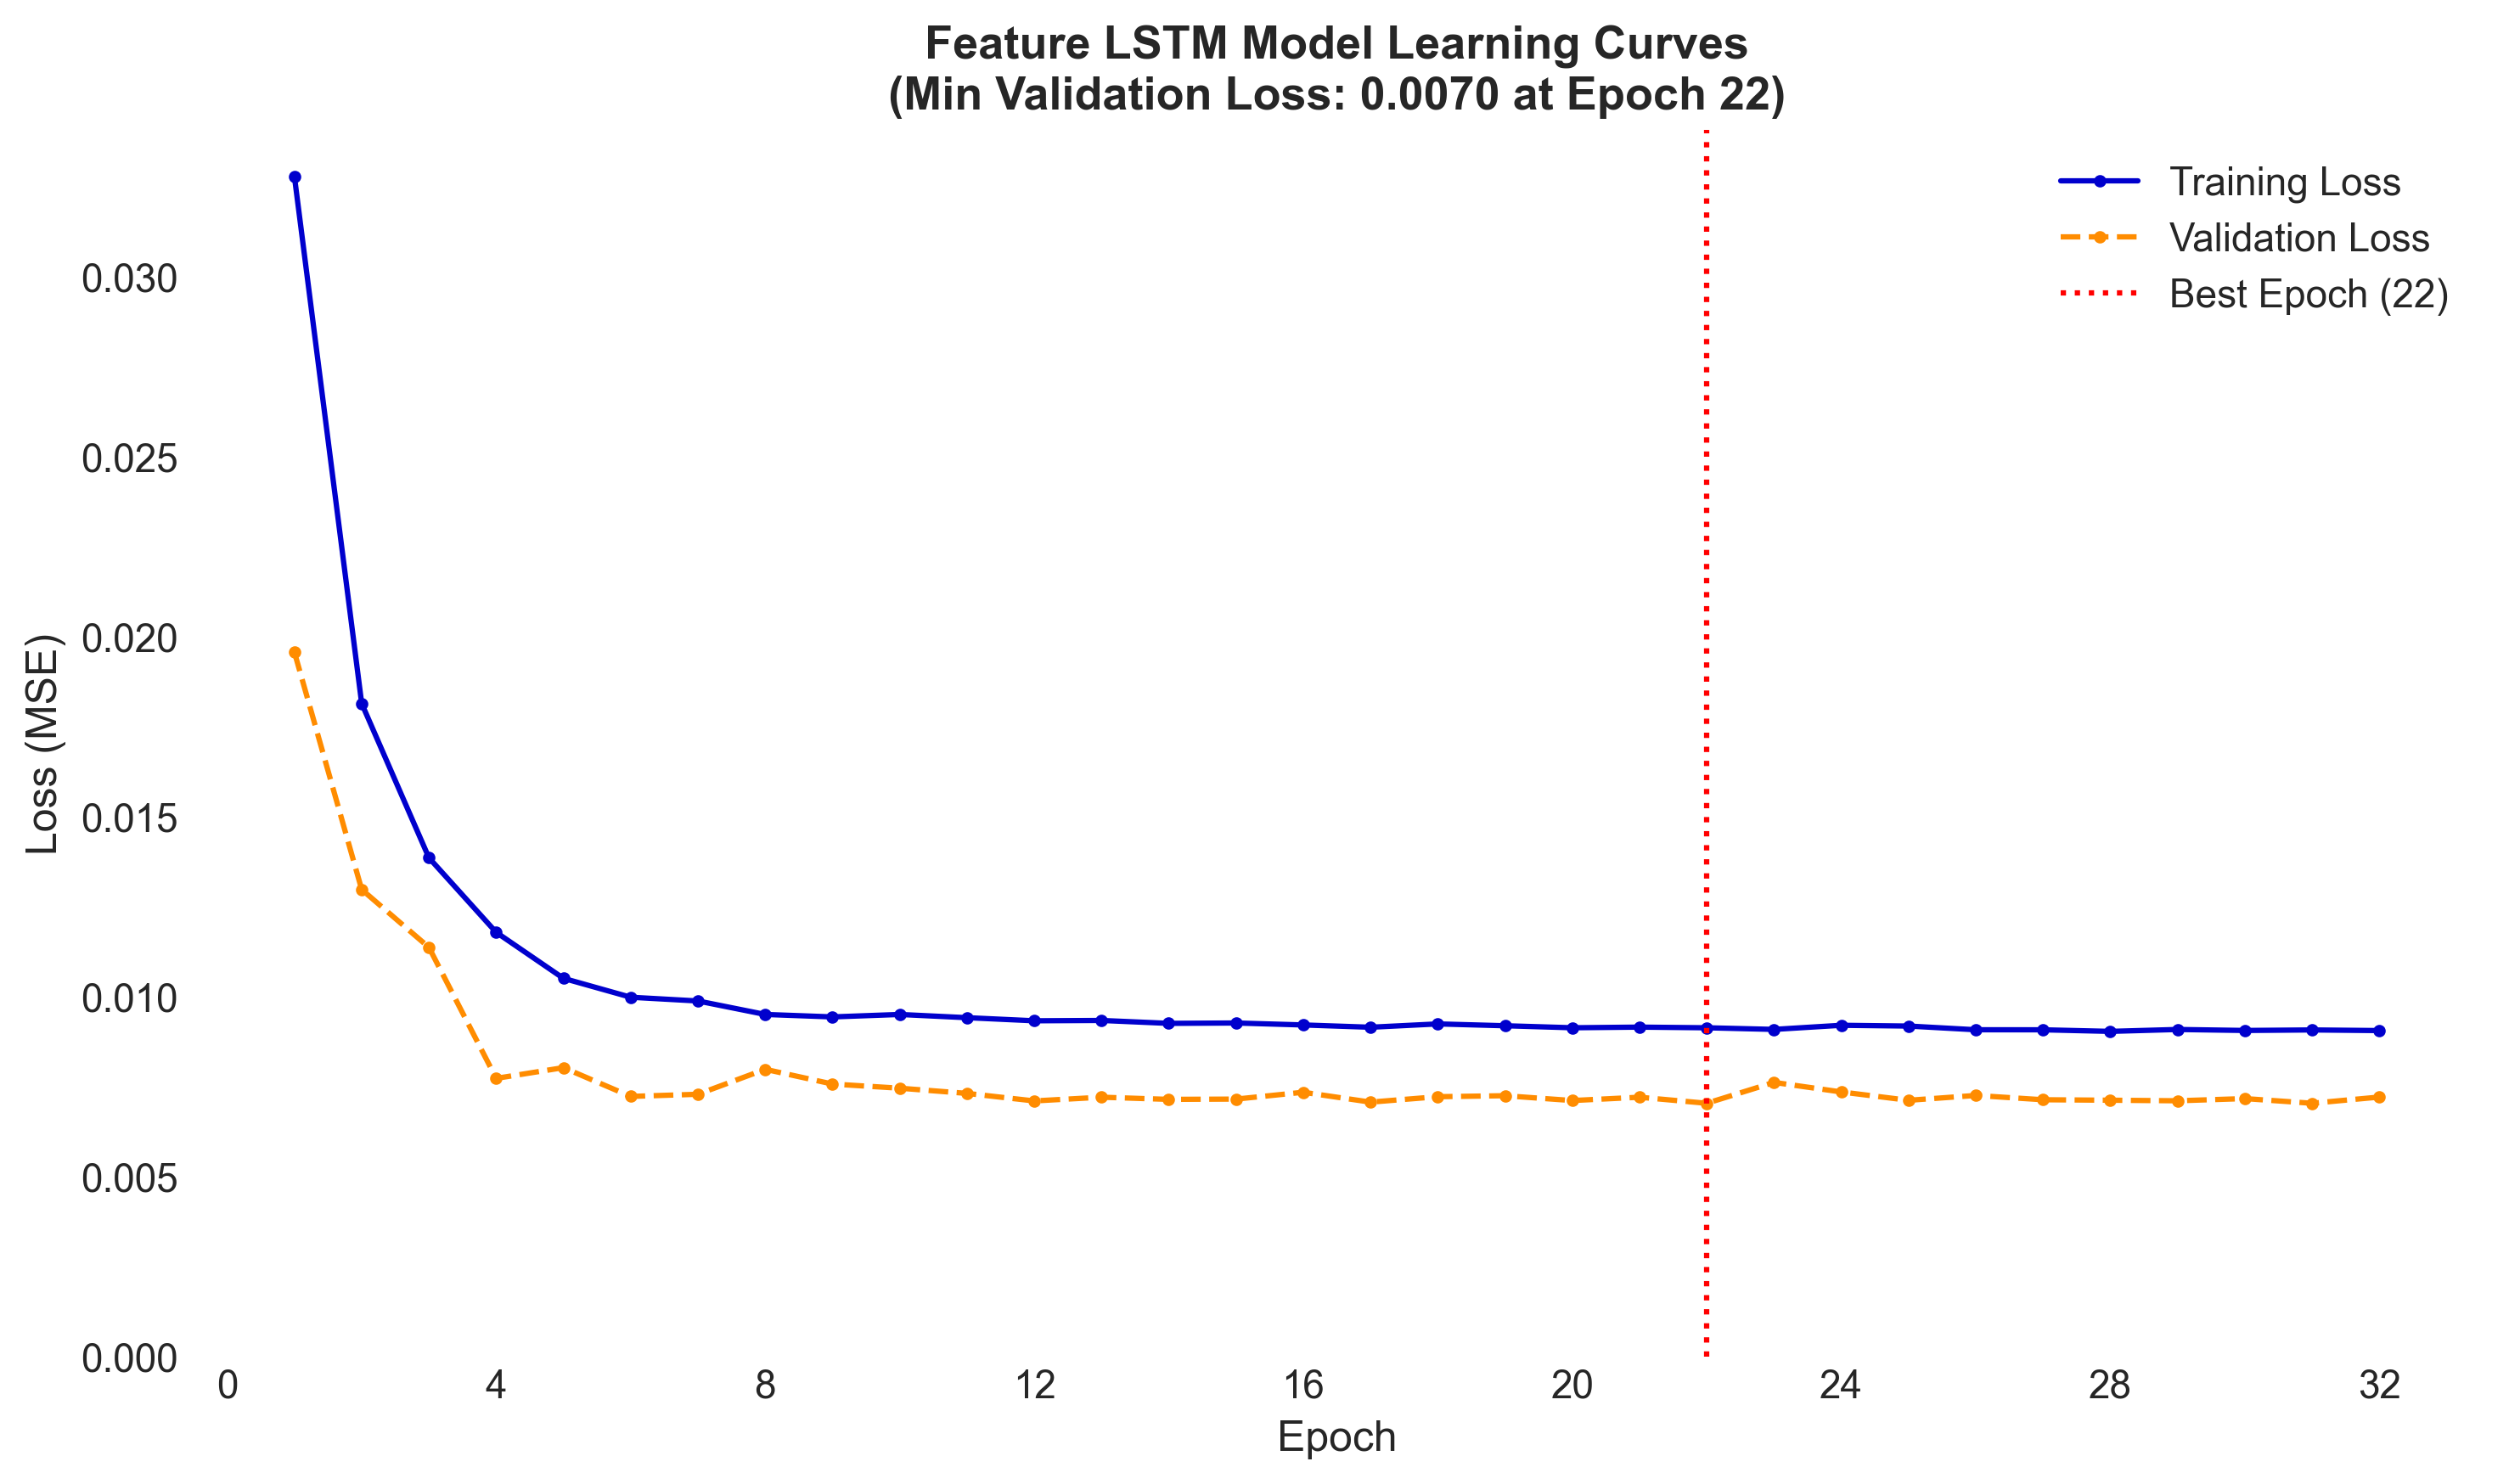
- LSTM: 2-layer Keras Sequential model with early stopping & learning curves
- RF: 50-tree scikit-learn model using predicted LSTM features
- Evaluation Metrics: MAE, RMSE, R², IA, SDE, MAPE
- Visualization:
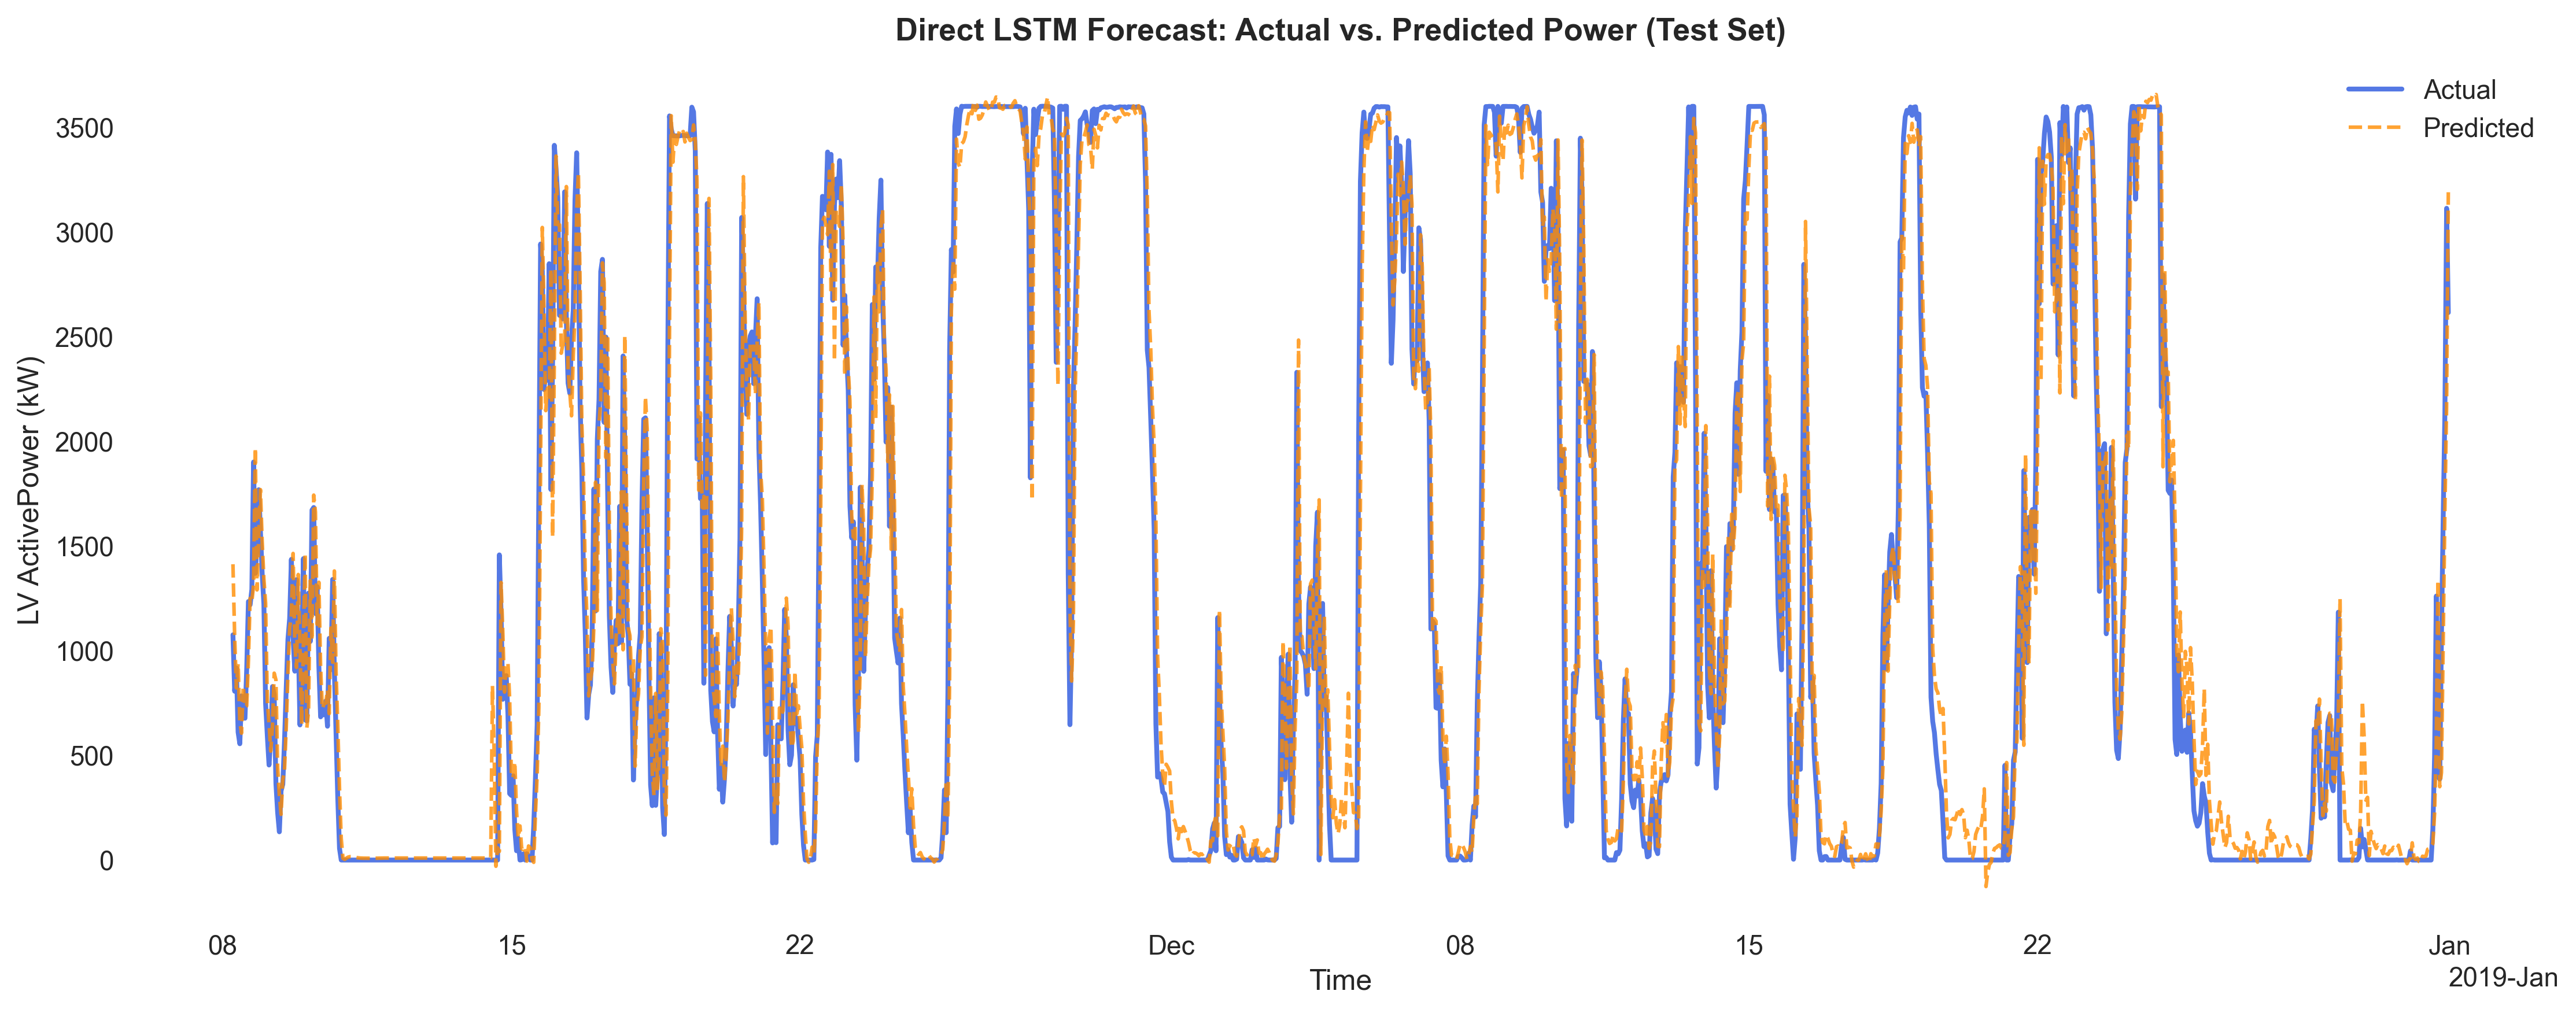
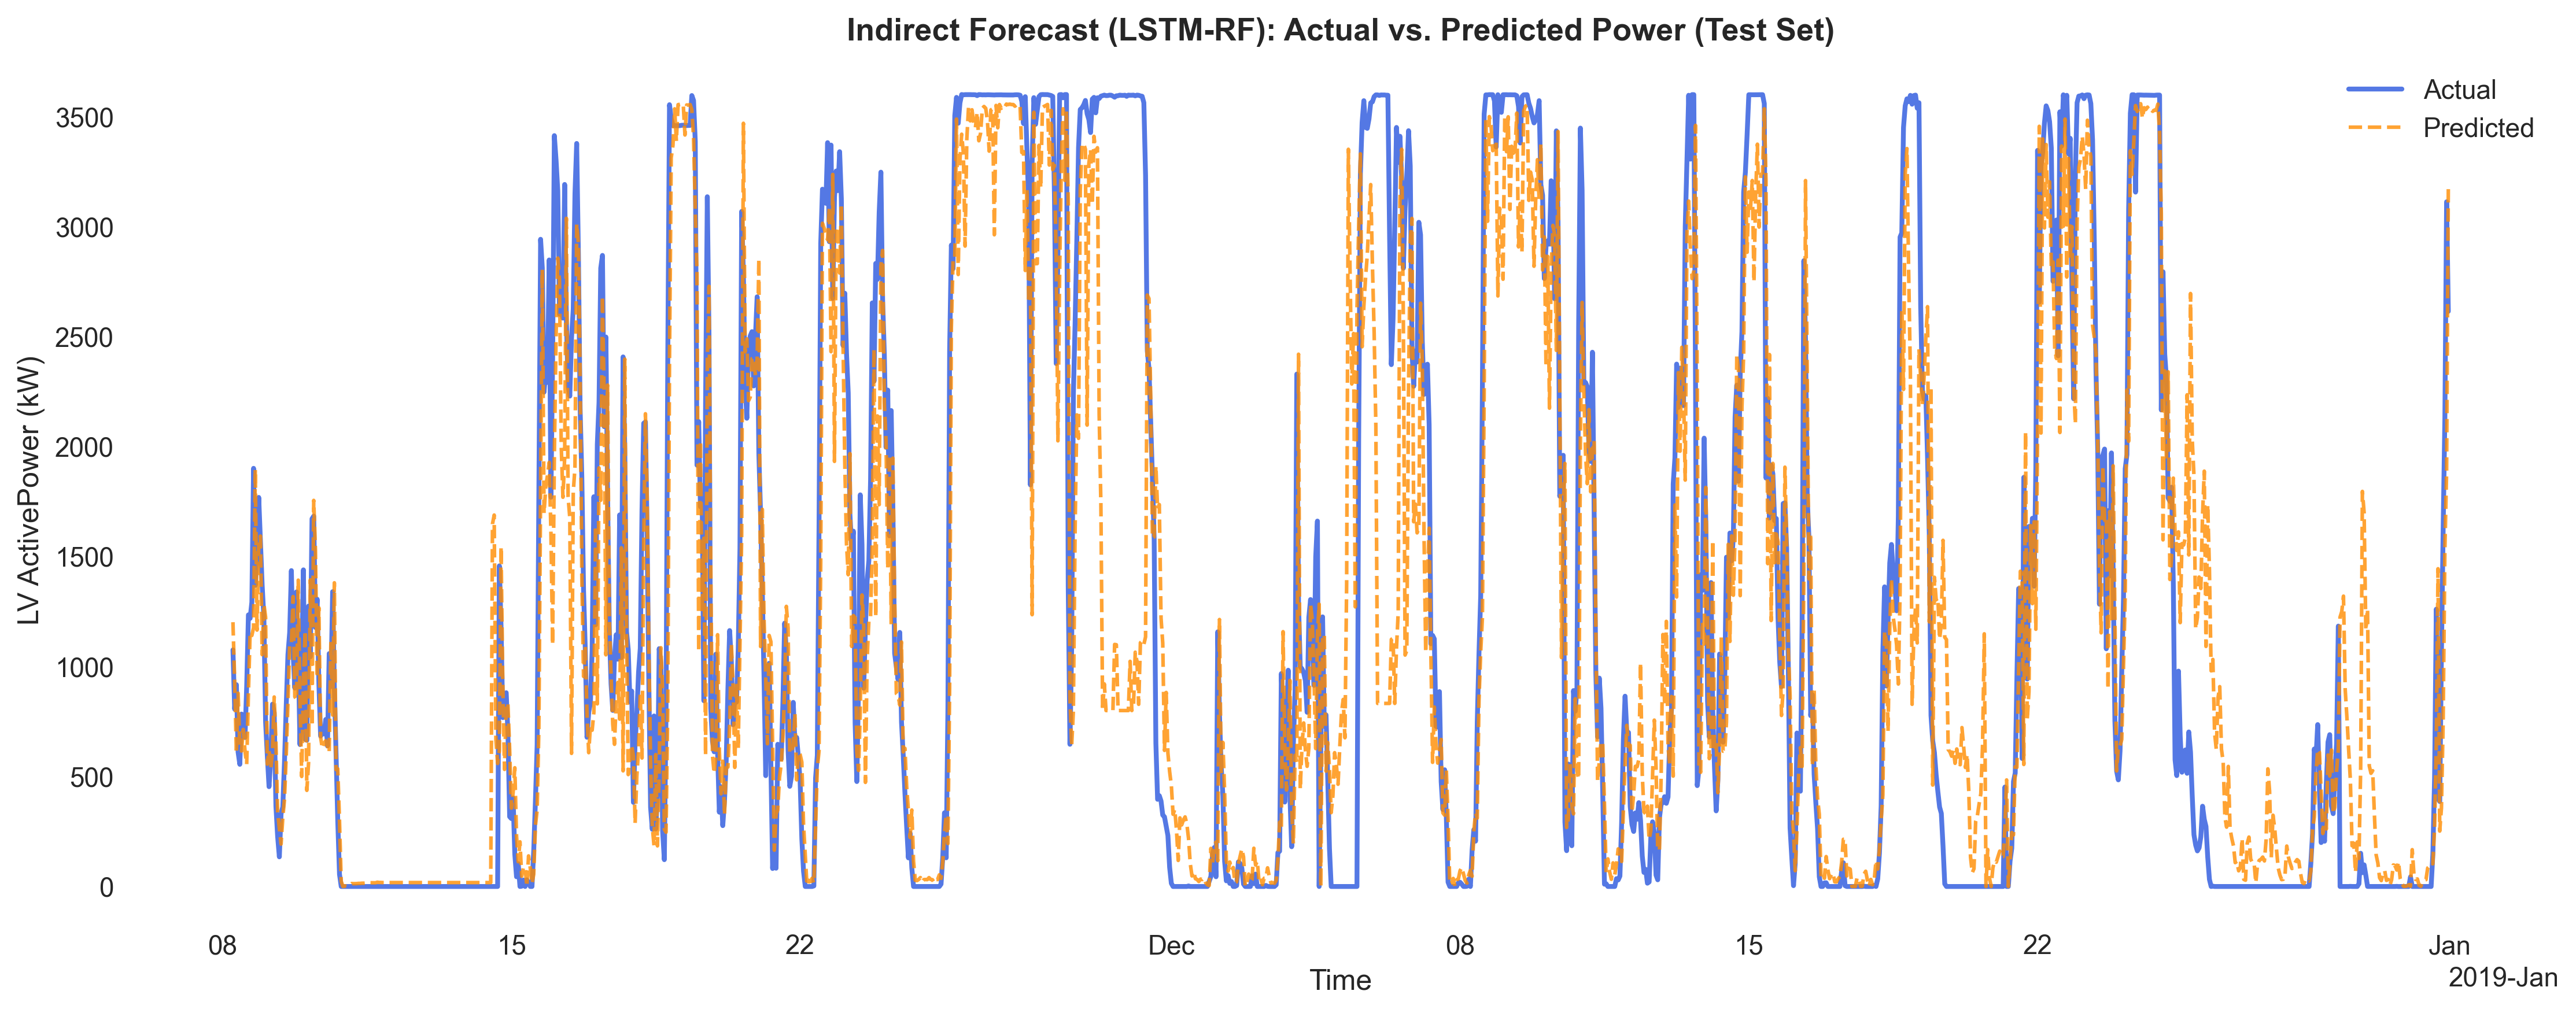
- Actual vs. Predicted curves
- Feature distributions and ACF/PACF
- Correlation heatmaps and learning curves
Pipeline
- One configurable pipeline runs both approaches end to end
- Metrics are computed after undoing the scaling, so they are in kW
- Models, plots and metrics are saved for each run
- Shared utilities for scaling, splitting and building input sequences
Results & Findings
| Approach | MAE | RMSE | R² | IA | SDE | MAPE |
|---|---|---|---|---|---|---|
| Direct LSTM | 231.81 | 375.24 | 0.9261 | 0.9805 | 374.72 | 288.02 |
| Indirect (LSTM → RF) | 429.12 | 720.31 | 0.7278 | 0.9170 | 711.10 | 1017.82 |
MAE, RMSE and SDE are in kW; MAPE is in percent.
- The direct LSTM wins on every metric. Its RMSE is about half that of the two-stage pipeline.
- Errors compound in the two-stage pipeline. The Random Forest was trained on real weather features but receives the LSTM's predicted ones, so the LSTM's errors pass straight into the power estimate.
- MAPE is not a fair metric here. A turbine often produces close to zero power, and dividing by near-zero values inflates the percentage error (288% even for the better model). MAE and RMSE are the numbers to trust.
Output Examples: Learning Curves
| Direct LSTM | Indirect LSTM |
|---|---|
 |  |
Output Examples: Actual vs Predicted (Test Set)
| Direct LSTM | Indirect RF |
|---|---|
 |  |
Next
Next steps worth trying: real weather forecasts as inputs instead of predicted ones, a metric that handles zero output (such as normalised MAE), and probabilistic forecasts that give a range instead of a single value.

